
Everything a student needs, all in one place.
Small groups, and includes a FREE membership!
Designed to target your weakest areas.
€200+ per year?!
Primary features are just notes/slides, quizzes and videos?
No instant teacher video support?
€30+ each?!
Huge class sizes?
Or unqualified tutors?
No free membership included?
€50+ each?!
Can’t be booked one at a time?
Not offered at all?
In addition to on-demand videos, the primary other feature of most membership websites is non-interactive notes/slides.
In contrast, our members gain access to all of our interactive DIGITAL LESSONS, allowing students to learn the subject more effectively.
Each of our lessons highlight the following:
1) KEY POINTS
The most important parts of the lesson.
2) CAUSES OF CONFUSION
Common mistakes that students make.
3) EXAM TIPS
Tips to give students that extra edge on the exam!
Rather than only having a teacher to help you while in school, wouldn’t it be great if you had access to a teacher while you are studying at home as well?
Well, we provide exactly that!
For every school day of the year, our teacher, Dr. Ciarán Kenny, offers live video support from 4pm using what we call TEACHER LIVE!.
Each school day, members can request a video call on Google Meet (Google’s version of Zoom), ask their question using their microphone, and then watch as Mr. Kenny answers that question then and there using his digital whiteboard. Nice!
Need help outside of Teacher Live! hours? We got your covered!
Regardless of whether it is the weekend, a bank holiday etc., students can continue to get the support that they need.
Using our TEACHER CHAT feature (shown in the bottom right), students can send us questions at any point during the school year. Within 24 hours (typically much sooner!), we will then answer that question with text, images and/or videos when necessary!
In addition to our free past paper video walkthroughs, we also include lots of additional ON-DEMAND VIDEOS with our membership!
For example, each our mock exams not only come with written answers and solutions, but also video walkthroughs!
We also provide what we refer to as KNOWLEDGE CHECKS at the end of every digital lesson.
These quizzes consist of quick-fire questions that give students immediate feedback as to whether that digital lesson “clicked” or not.
If that lesson clicked, students can then proceed to our corresponding practice questions for that lesson. If not, rather than jumping straight into attempting questions that they may not be ready for, students can instead first turn to one of our other features to help with their understanding, e.g. Teacher Live!
The only visual aids that are provided to students in a schoolbook are static images.
In contrast, we provide vibrant ANIMATIONS throughout our digital lessons.
These animations offer a more effective way of visually learning a new concept and of keeping a student engaged.
We provide our members with just as many PRACTICE QUESTIONS as found in a schoolbook.
As in a schoolbook, these questions are of varying difficulty, both at Higher Level and at Ordinary Level, thereby allowing students to build up their understanding towards exam-type questions.
Unlike a schoolbook, as described in our “Layered Solutions” feature below, students can assess their understanding of each question in three different ways: with answers, solutions and walkthroughs!
We provide students with our own MOCK EXAMS that are exclusive to our members.
Our mock exam questions can be sorted both by exam and by topic!
Our MOCK EXAM SOLUTIONS consist of three different methods for students to check their understanding of each question.
1) ANSWERS
These allow students to quickly check if they did the question correctly.
2) SOLUTIONS
These show students what should they write down when answering the question.
3) VIDEO WALKTHROUGHS
These offer explanations as to where the solutions come from.
As always, even in the unlikely event that students still do not understand a particular question, they can also get additional support on Teacher Live!
Each of our practice questions include LAYERED SOLUTIONS in the form of three different methods for students to check their understanding:
1) ANSWERS
These allow students to quickly check if they did the question correctly.
2) SOLUTIONS
These show students what they should write down when answering the question.
3) WALKTHROUGHS
These explain to students where each solution comes from.
Therefore, unlike a schoolbook, not only do we provide the answers at the back of a schoolbook, not only do we provide the solutions found in a teacher’s handbook, but we also include walkthroughs, i.e. what a teacher would say if they explained the solution to you.
Can you imagine having answers, solutions and walkthroughs to every single exercise question in your schoolbook? Well, we provide exactly that!
We make no assumptions about a student’s understanding of Junior Cycle maths, whether they did Higher Level or Ordinary Level maths etc.
Instead, any time we feel that some students may first require a quick recap, we provide that J.C. MATHS MATERIAL content in a tab at the start of the corresponding digital lesson.
We provide concise REVISION SHEETS that allow students to quickly confirm that they understand all of the essentials for every topic.
As with our digital lessons, each sheet comprises a collection of the most important points of each topic in three different categories.
1) KEY POINTS
The most important parts of the topic.
2) CAUSES OF CONFUSION
Common mistakes that students make.
3) EXAM TIPS
Tips to give students that extra edge on the exam!
An example of such a revision sheet is provided for free below!
Note: Our 2023/24 memberships are now closed.
Instead, all students who sign up to our final revision course will get a membership included for free.
The majority of other membership websites are significantly more expensive and focus primarily on just two features: videos and notes/slides.
In particular, such memberships typically include little (if any) direct student-teacher interaction.
In contrast, we offer such interactions with a qualified teacher every school day via our Teacher Live! and Teacher Chat features, in addition to offering many other features that are unique to our website.
We give every new member 24 hours to check out all of our resources and features and, in the unlikely event that you don’t like what we offer, you can ask for a full refund – no questions asked!
YES!
Students are free to become a member at any point during the year.
Of course, the earlier you join, the more time you will have to make use of our resources.
The sooner, the better!
All of our resources have been optimised to work across all of the usual devices – computers, tablets and smartphones!
Below, we’ve listed the actual prices for annual memberships on several websites in addition to our opinions as to what those memberships should actually cost.
L.C. MATHS
Actual Price: €79
Our Opinion: €128
DUBLIN ACADEMY
Actual Price: €525
Our Opinion: €12
EXAM REVISION
Actual Price: €405
Our Opinion: €23
THE MATHS TUTOR
Actual Price: €299
Our Opinion: €23
If you’d like to see where these figures came from, click the button below!
We shall group features into five categories, ranked from highest to lowest value.
2) TEACHER LIVE! + 3) TEACHER CHAT
Teacher Live! gives our students to get instant video support from a qualified teacher live on stream every school day.
We shall generously value this unique feature at just 20 cent per day, i.e. roughly €50 per school year.
Teacher Chat is, in a sense, a “backup” to Teacher Live! for other days, allowing students to also get direct teacher support but not instantly.
We shall therefore instead value this feature at €10 per school year.
TOTAL VALUE: €60
The overwhelming majority of other membership websites include only static resources, i.e. resources that just sit there and generate revenue. Dynamic resources such as Teacher Live! would cause a dramatic loss of revenue and are therefore typically not included with memberships.
At best, a small number of websites will instead offer a “watered down” version of Teacher Chat in which they will answer your question within some unspecified time window.
TOTAL VALUE: €0 – €10
1) DIGITAL LESSONS + 7) PRACTICE QUESTIONS + 10) LAYERED SOLUTIONS
In essence, these three features together correspond to the content included in both a typical schoolbook and workbook.
Although our digital lessons are much more detailed than the chapters of a schoolbook, and although workbooks typically only contain answers rather than layered solutions, we will again be generous and value these three features together at the price of a typical schoolbook and workbook.
TOTAL VALUE: €40
The overwhelming majority of other membership websites typically only include (less detailed) digital notes or slides rather than digital lessons.
Likewise, there is typically an absence of solutions to full exercise set questions (if those questions exist at all). Instead, websites typically resort to only creating solutions to self-corrected quizzes (see below) as these can be created with a lot less effort.
TOTAL VALUE: €5 – €20
5) QUIZZES + 6) ANIMATIONS + 11) J.C. MATHS MATERIAL
Our self-corrected quizzes allow students to track their own progress.
Our animations allow students to more easily understand the corresponding material.
Our J.C. maths material ensures that students don’t fall behind if they for how to do something from their Junior Cycle.
Although very beneficial, these features take significantly less time to create compared with e.g. digital lessons.
For simplicity, we will therefore value each of them at €5 each.
TOTAL VALUE: €15
Most other membership websites include quizzes, some other membership websites include J.C. maths material and the overwhelming majority don’t include animations.
TOTAL VALUE: €0 – €10
8) MOCK EXAMS + 9) MOCK EXAM SOLUTIONS + 12) REVISION SHEETS
Mock exams can be purchased for a couple of euro each.
Likewise, as revision books can be purchased in a bookstore for approximately €10, revision sheets should also have a value of only a only a couple of euro.
Together, we shall value our revision material at €12.
TOTAL VALUE: €12
Many membership websites include all three of the above, some only include, mock exam papers, some only include revision sheets and some included none at all.
TOTAL VALUE: €0 – €12
4) ON-DEMAND VIDEOS
We include on-demand videos across our website, including video solutions to practice questions, mock exams etc.
Other websites typically make such videos their main selling point, and for good reason – they are the quickest and easiest resource to create.
For example, 50 hours of content can quite easily be recorded in just a single month (including prepping, editing and uploading).
That content can then be used to either 1) create a 50 hour “on-demand course” or 2) to be chopped into hundreds (or even thousands) of short videos.
If we fairly assume that the video creator deserves to earn €10,000 for that month’s work, and if we fairly assume that those videos are watched by 10,000 students in the years (or even decades) that they are made available, those 50 hours of videos are valued at just €1.
TOTAL VALUE: €1
In this case, we will be generous and allow for the possibility that some websites have five times as much video content as we do (even though we have no evidence for this to be the case).
TOTAL VALUE: €1 – €5
In summary, the primary benefits on other websites typically focus on the cheapest categories above while also including only a sprinkle of the other more expensive categories.
We offer our memberships cheaper than what we believe they are worth as we are completely satisfied on the income that we generate at that lower price point.
In contrast, other websites take the opposite approach. It is instead our opinion that they offer significantly less benefits at what we consider to be significantly inflated prices.
Note: Our 2023/24 weekly classes are now closed.
At this time of year, we instead recommend that students sign up to our 25 day final revision course here.
We believe that there are five key elements associated with effective online classes:
1) Qualifications: Are all of the classes given by qualified, experienced teachers?
2) Class Size: Are the class sizes significantly smaller than in a free public school (≤ 12)?
3) Price: Are the classes significantly cheaper than one-to-one grinds (≤ €12)?
4) Benefits: Are more than 75% of our membership features included with the classes?
5) Support: Can I get additional instant video help from my class teacher every school day?
Although we consider these five qualities to be the bare minimum as to what should be expected from online classes, you may be surprised to find that the majority of other popular educational support websites only satisfy one of these requirements!
A detailed comparison table for each of the websites above can be displayed by clicking the buttons below!
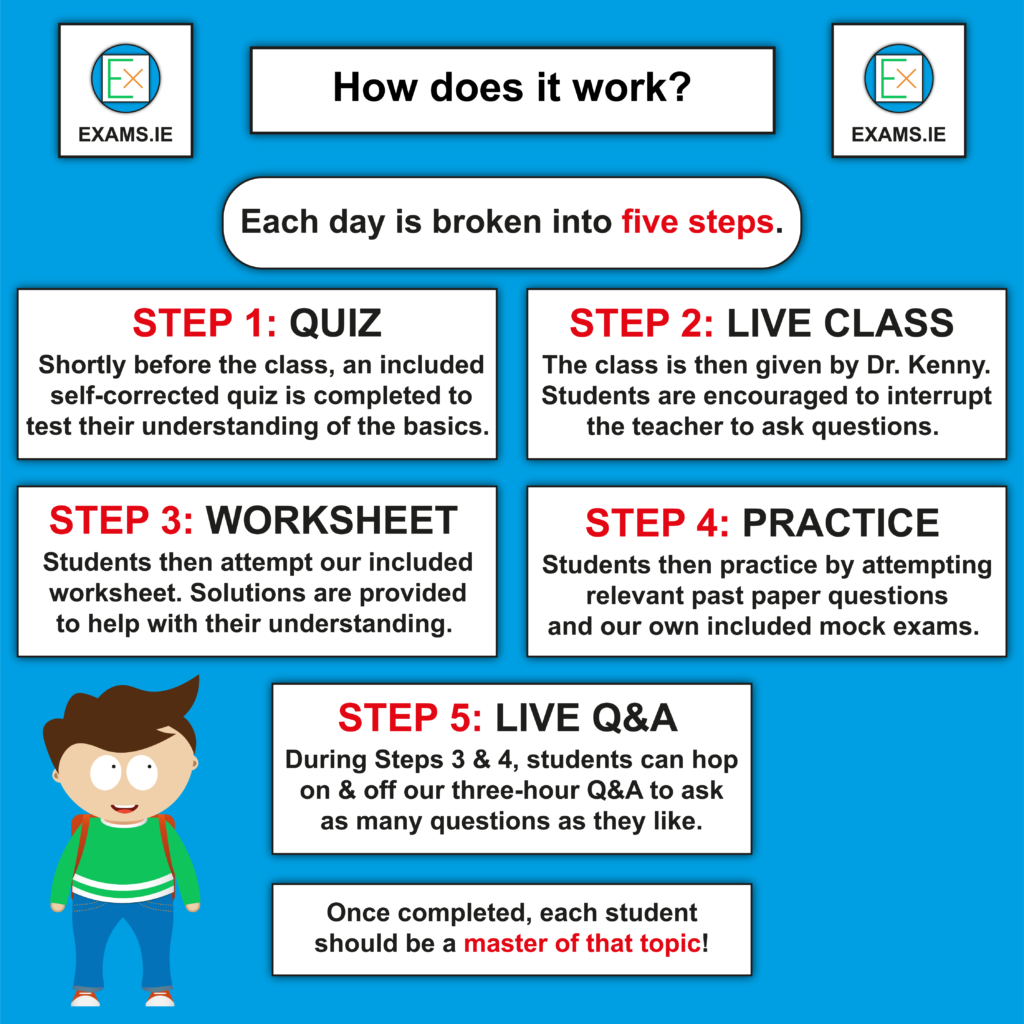
The first 5 – 10 minutes are spent checking if each student recalls and still understands the material from the previous week’s class.
This is of particular importance if the material of the current class directly relies on a deep understanding of the material from the previous class.
The teacher then introduces and explains the new concept(s).
Throughout this stage, the teacher will be frequently checking each student’s understanding by asking them questions.
Before jumping into practice questions, the class will then spend 5 minutes going through one of our own custom-made “Knowledge Checks”.
These quizzes consist of quick-fire questions which give the teacher immediate feedback as to whether the new material has “clicked” or not.
Based on the results of this quiz, the teacher may also decide to briefly return to stage 2 again above before proceeding to stage 4 below.
The teacher will then check each student’s understanding of the material by assigning some practice questions. This is typically done in three parts:
a) The teacher alone will go through the solutions to some questions.
b) The teacher & students will then go through the solutions to some questions together. The teacher will ask one student how to do the first step of a question, then another how to do the next step etc.
c) The students will then go through a question or two in full by themselves. The teacher will continuously ask students how they are getting on and will encourage them to ask for help if they get stuck.
In the last five minutes, the class as a whole will discuss how confident they feel in this new material.
The teacher will also provide additional practice questions for students to attempt in their own time.
Students will also be reminded that, if they get stuck attempting any of these questions, they can ask for immediate help on Teacher Live! or Teacher Chat while that issue is fresh in their mind rather than waiting until the next class.
Absolutely!
However, as we keep our class sizes small, we may not have any timeslots remaining once terms starts.
The sooner, the better!
We offer the ability to create an additional timeslot for a group of students to be given at a time that suits that group.
Therefore, if many of your classmates/friends feel that they would benefit from having such classes, let us know at [email protected] and we’ll create that timeslot for your group!
Below, we’ve listed the actual prices for classes on several websites in addition to our opinions as to what those classes should actually cost.
L.C. MATHS
Actual Price: €10
Our Opinion: €20
DUBLIN ACADEMY
Actual Price: €37
Our Opinion: €4
BREAKTHROUGH MATHS
Actual Price: €38
Our Opinion: €10
INSTITUTE OF EDUCATION
Actual Price: €38
Our Opinion: €4
If you’d like to see where these figures came from, click the button below!
We’ll be quite generous in terms of what is considered to be a “fair price” for classes:
1) We’ll assume that a qualified teacher generating up to €160 in revenue per class is considered “fair”.
2) We’ll assume that an unqualified tutor generating up to €80 in revenue per class is considered “fair”.
For simplicity, we’ll place classes into one of the following three categories depending on class size:
1) Small group classes (maximum size of 8).
2) Large group classes (maximum size of 20).
3) Unrestricted classes (no set maximum size).
We’ll again be quite generous by assuming that “unrestricted” classes contain 40 students (even though our students have informed us that such classes are often a lot larger!)
After some quick maths, we arrive at the following prices for six different classroom environments, ranked from best to worst:
A) Small group classes with a qualified teacher should cost at most €20 each.
B) Small group classes with an unqualified tutor should cost at most €10 each.
C) Large group classes with a qualified teacher should cost at most €8 each.
D) Large group classes with an unqualified tutor should cost at most €4 each.
E) Unrestricted classes with a qualified teacher should cost at most €4 each.
F) Unrestricted classes with an unqualified tutor should cost at most €2 each.
Although we fall into category A, we do not charge the stated price of €20. Instead, as we feel that we have been quite generous in our assumptions above, we believe that the prices above are in fact too high.
“Don’t many classes also come with lots of additional benefits?”
Absolutely, including ours!
The features included with our free membership contain a lot more benefits than those included elsewhere. As such, if we also took into account the added benefits offered by other websites, it would make their prices look even worse.
If you are considering classes elsewhere, we strongly recommend first placing those classes into the one of the above categories to determine if you are being charged a fair price or not.
The most effective way for a student to learn from a teacher is one-to-one.
Even so, all of the websites that we have previously mentioned have one thing in common – not a single one of them offers one-to-one tuition.
Such websites are therefore openly admitting that they do not offer the most effective means for their own students to learn.
The reason? One-to-one classes and grinds are not as profitable as group classes and grinds.
The education of students is therefore not their primary motivation.
In addition, offering such one-to-one tuition would further highlight how expensive their group classes and grinds are in comparison.
We, however, will always offer the tuition that results in the greatest improvements, regardless of whether that makes financial sense or not.
Our one-to-one grinds cost €35 each.
Easy!
After clicking the timeslot for your first grind, you will redirected to our checkout page where you will once again see the calendar above.
From there, each additional timeslot that you choose will be added to your basket so that you may book all of your grinds at once!
Each of our grinds students receive their own (password-protected) personalised webpage in which the recordings of all of their grinds (and additional practice questions) are conveniently located. [Example]
In addition to fake reviews (see below), the following are unfortunately also very common in Irish educational support:
1) Incentivised Reviews: Many websites ask students to leave reviews with the promise of receiving future discounts, entries to prize draws etc. in return.
2) Deleted Reviews: Many of our students have stated that the negative reviews that they (or their parents) have left on social media pages, Trustpilot etc. for other websites have been removed without explanation.
In fact, based on the information provided by those students, such tactics appear to be not only commonplace but in fact the norm.
We therefore strongly discourage anyone from choosing their educational support based purely on online reviews, testimonials etc.
Below, we have placed fake or misleading reviews into four categories.
On the homepage of many websites, you will find photos or videos of the students and parents themselves, often together with their parent’s review.
These photos and videos often include young children, e.g. Junior Cycle students (or even younger).
These are typically either paid-for reviews or people associated with the employees.
Parents are unlikely to sacrifice the privacy of their children purely because they liked a service that they paid for, especially when they can just write a review.
Instead, they need to be heavily incentivised to do so, either through cash or heavily discounted (or even free) grinds for the year.
Fake 5 star reviews are typically overly-detailed compared to genuine 5 star reviews.
(Typically, only negative genuine reviews are very detailed.)
Again, such detailed reviews are often paid-for reviews, incentivised reviews or are left by friends and family members of the employees (or by the employees themselves).
If students receive very good, but overpriced, support, you would expect to find many average reviews like the following:
“My daughter found the grinds helpful; however, I still thought that they were very expensive compared to other options.”
If you can’t find many reviews like this for what are clearly expensive websites, that should be an immediate red flag.
On most review platforms (social media, Trustpilot etc.), it is quite trivial to delete (or hide) negative reviews.
There will always be a small proportion of parents who expect miracles from grinds or classes and who will react negatively in their review if they do not receive that miracle.
A complete lack of negative reviews is therefore a bigger red flag than the presence of a small number of negative reviews.
As we are not a legal entity, we do not intend to offer legal opinions.
However, for the reader’s interest, we have provided some of the relevant regulations below in regards to fake reviews specifically.
We recommend that the reader comes to their own conclusions only after seeking professional legal advice.
“…falsely claiming or creating the impression that the trader is not acting for purposes relating to his trade, business, craft or profession, or falsely representing oneself as a consumer”
“A commercial practice is misleading if it would be likely to cause the average consumer to be deceived or misled in relation to any matter set out in subsection (3) [see link above] and to make a transactional decision that the average consumer would not otherwise make.“
“A marketing communication should not mislead, or be likely to mislead, by inaccuracy, ambiguity, exaggeration, omission or otherwise.”
“Endorsements by fictitious or historical characters should not be presented as though they are genuine testimonials.”
If you are a consumer, be it a previous customer or a potential customer, that believes that a service provided by any website is being offered under false pretences, you can make a complaint to the Advertising Standards Authority of Ireland (ASAI) here.
Likewise, if you have been offered entry into a prize draw etc. for leaving a review, or if your negative review has been removed without explanation, we also encourage you to issue a complaint using the link above.
If you are a previous customer who also wishes to receive compensation based on false pretences, we suggest that you also seek professional legal advice.
If you believe that your identity has been used to create such false pretences, we again suggest seeking professional legal advice.

I am an online educator with teaching and lecturing experience in maths, physics, applied maths, science and medicine both in Ireland and abroad.
Towards the end of my PhD in theoretical astrophysics, I began working on this website in order to provide students with the best Leaving Cert Maths resources possible, all in one place, and at the lowest possible price.


Exams.ie – Leaving Cert & Junior Cycle Resources
Junior Maths – Junior Cycle Maths
L.C. Maths – Leaving Cert Maths
A.M. Online – Leaving Cert Applied Maths
© Exams.ie. All Rights Reserved.